Documentation
vWap & Indicators
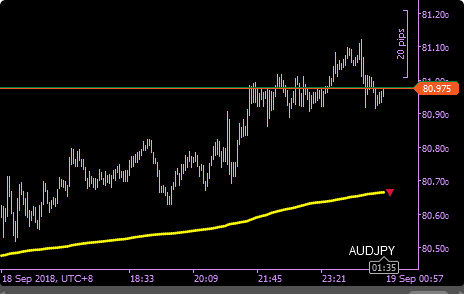
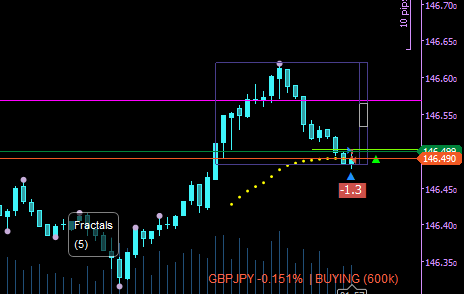
The vWap line, deviation bands and volume histogram are drawn directly on the chart and update in real time. The position panel shows your current symbol, direction (Buying / Selling / Hedging), profit & loss, position size and average entry price as a line on the chart.
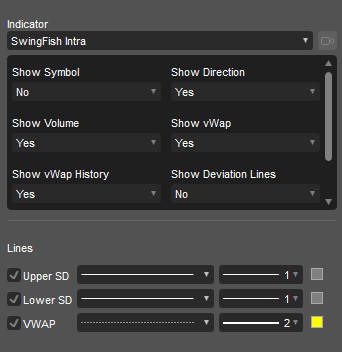
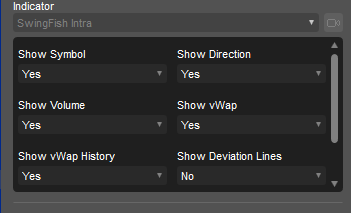
Settings
- Show Symbol - shows the current symbol on the chart
- Show Direction - shows "Buying", "Selling" or "Hedging"
- Show vWap - shows the last 20 vWap prices
- Show vWap History - shows a complete histogram
In order to check for updates and write logs, SwingFish apps may need internet and filesystem access, which is why you may be asked for full-access permission. We do not collect or send any data to our servers.